Data visualization
A storytelling process of bringing data to life with clear intent, and measurable impact
Data is the essential building block shaped by a clearly defined user goal or intent.
The narrative arc should show the path to a possible success state, resolving user conflicts to build trust and drive action
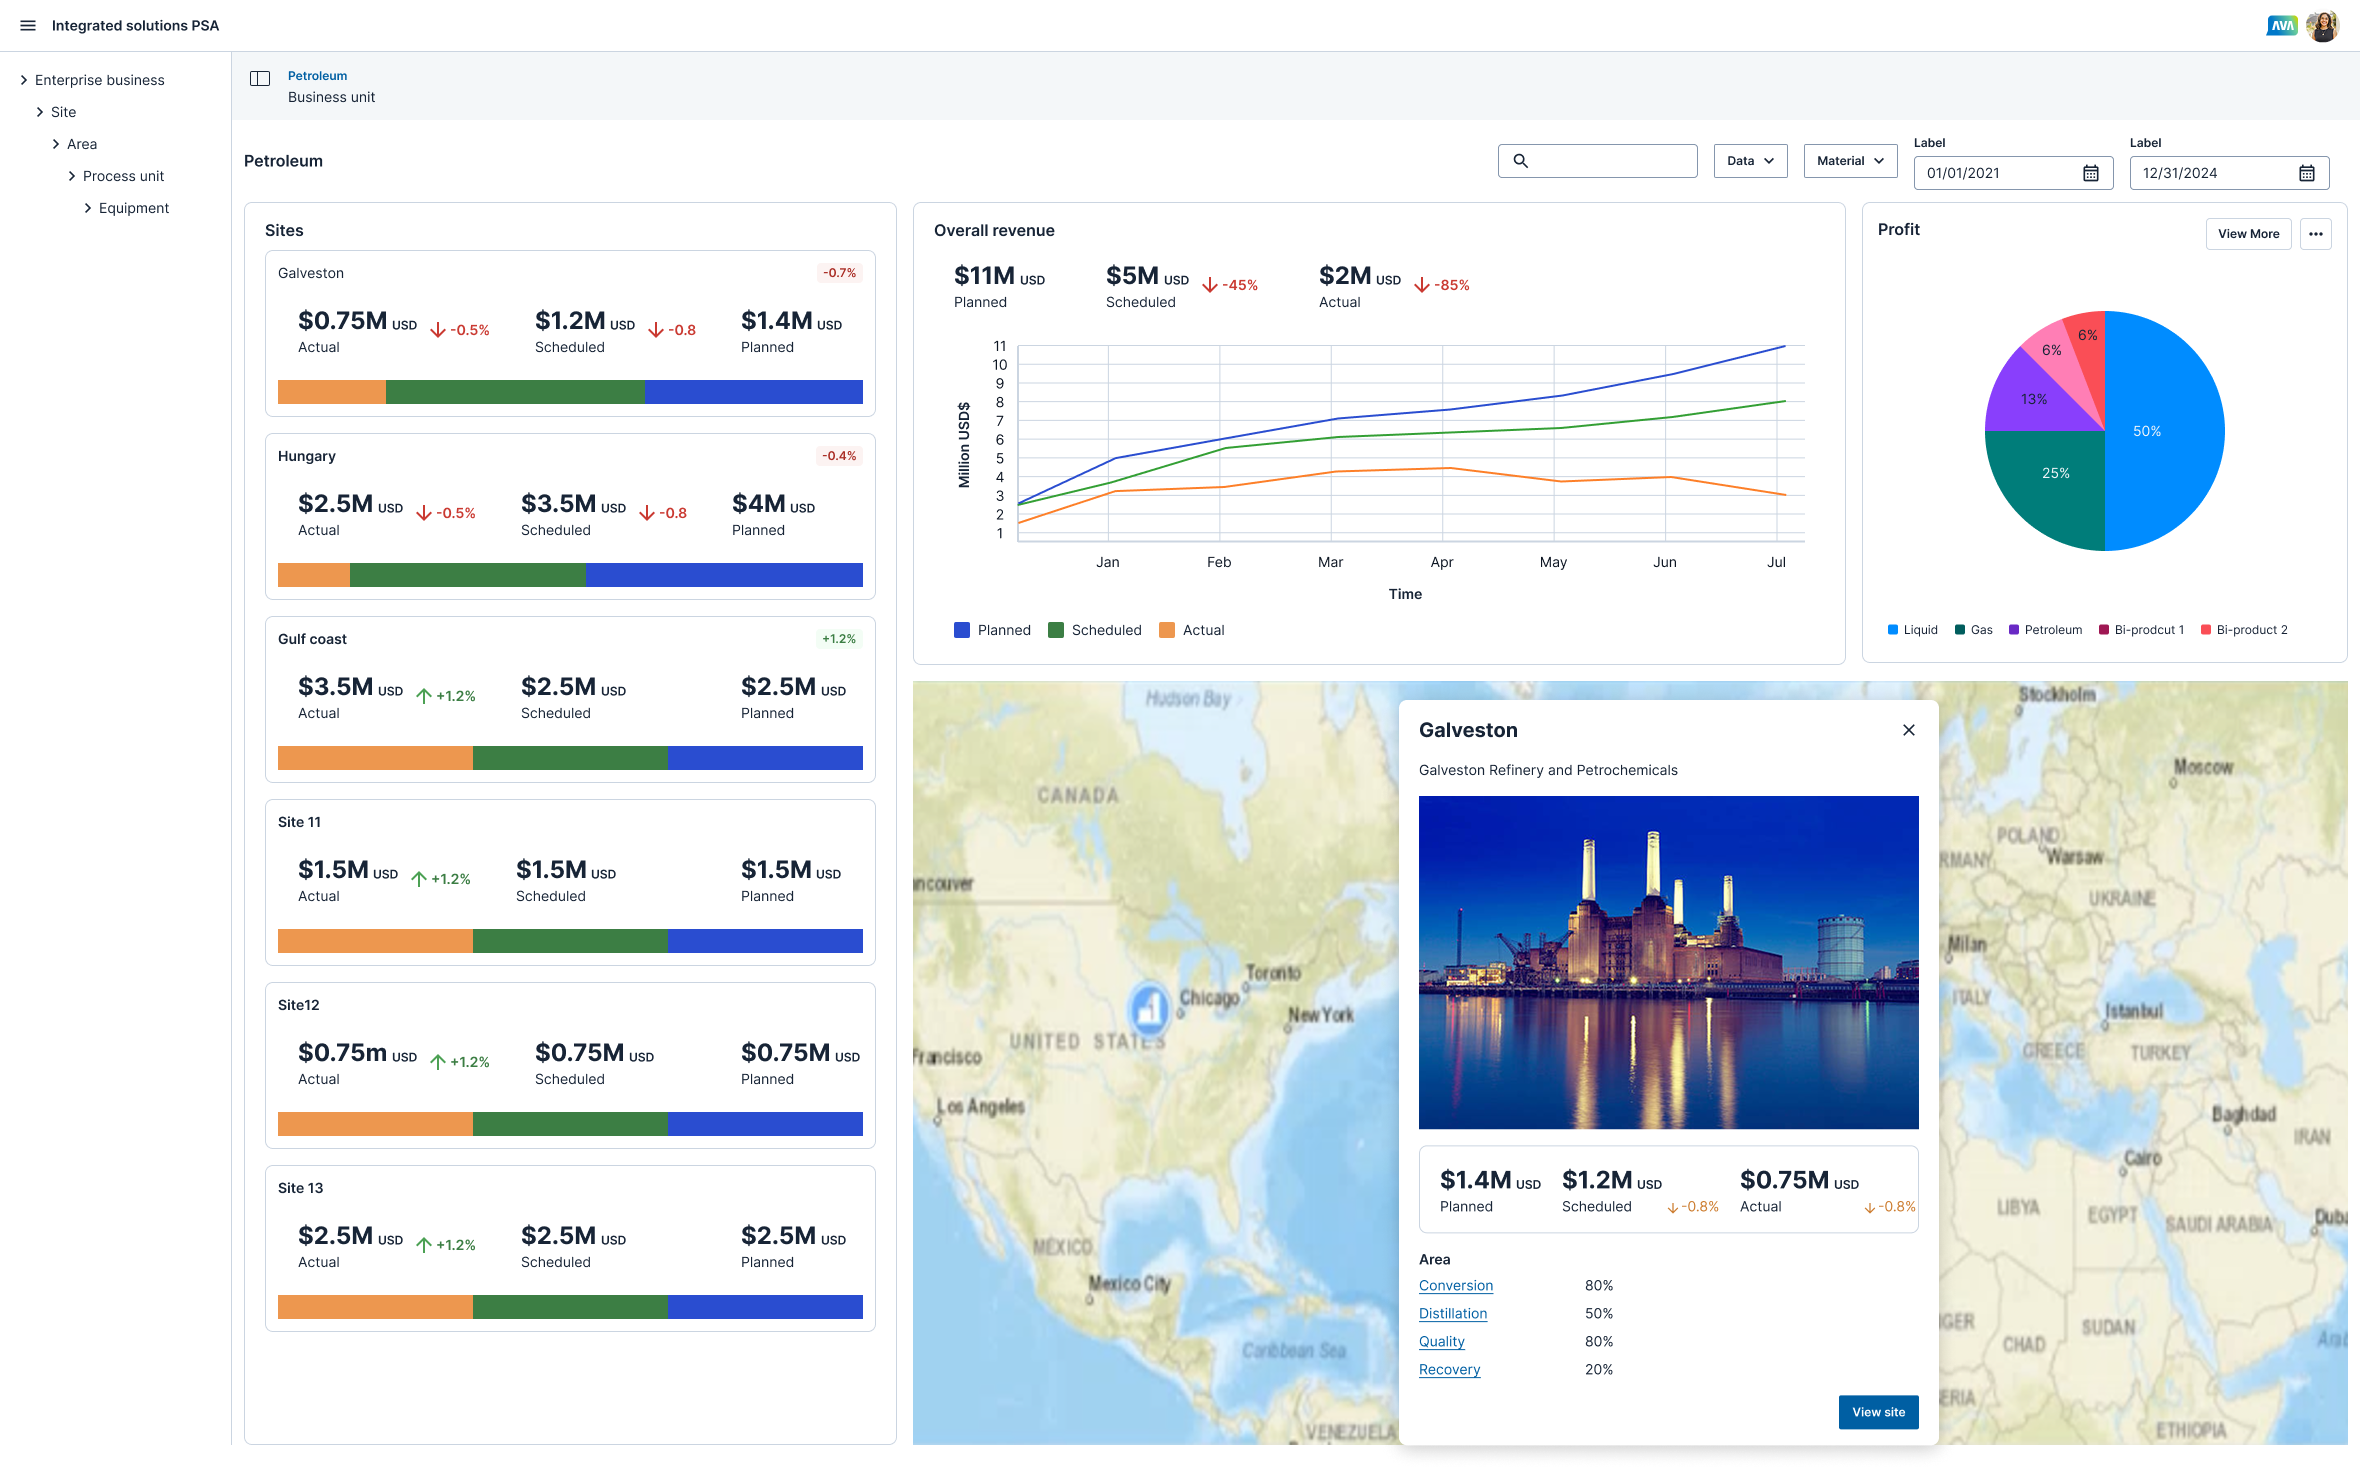
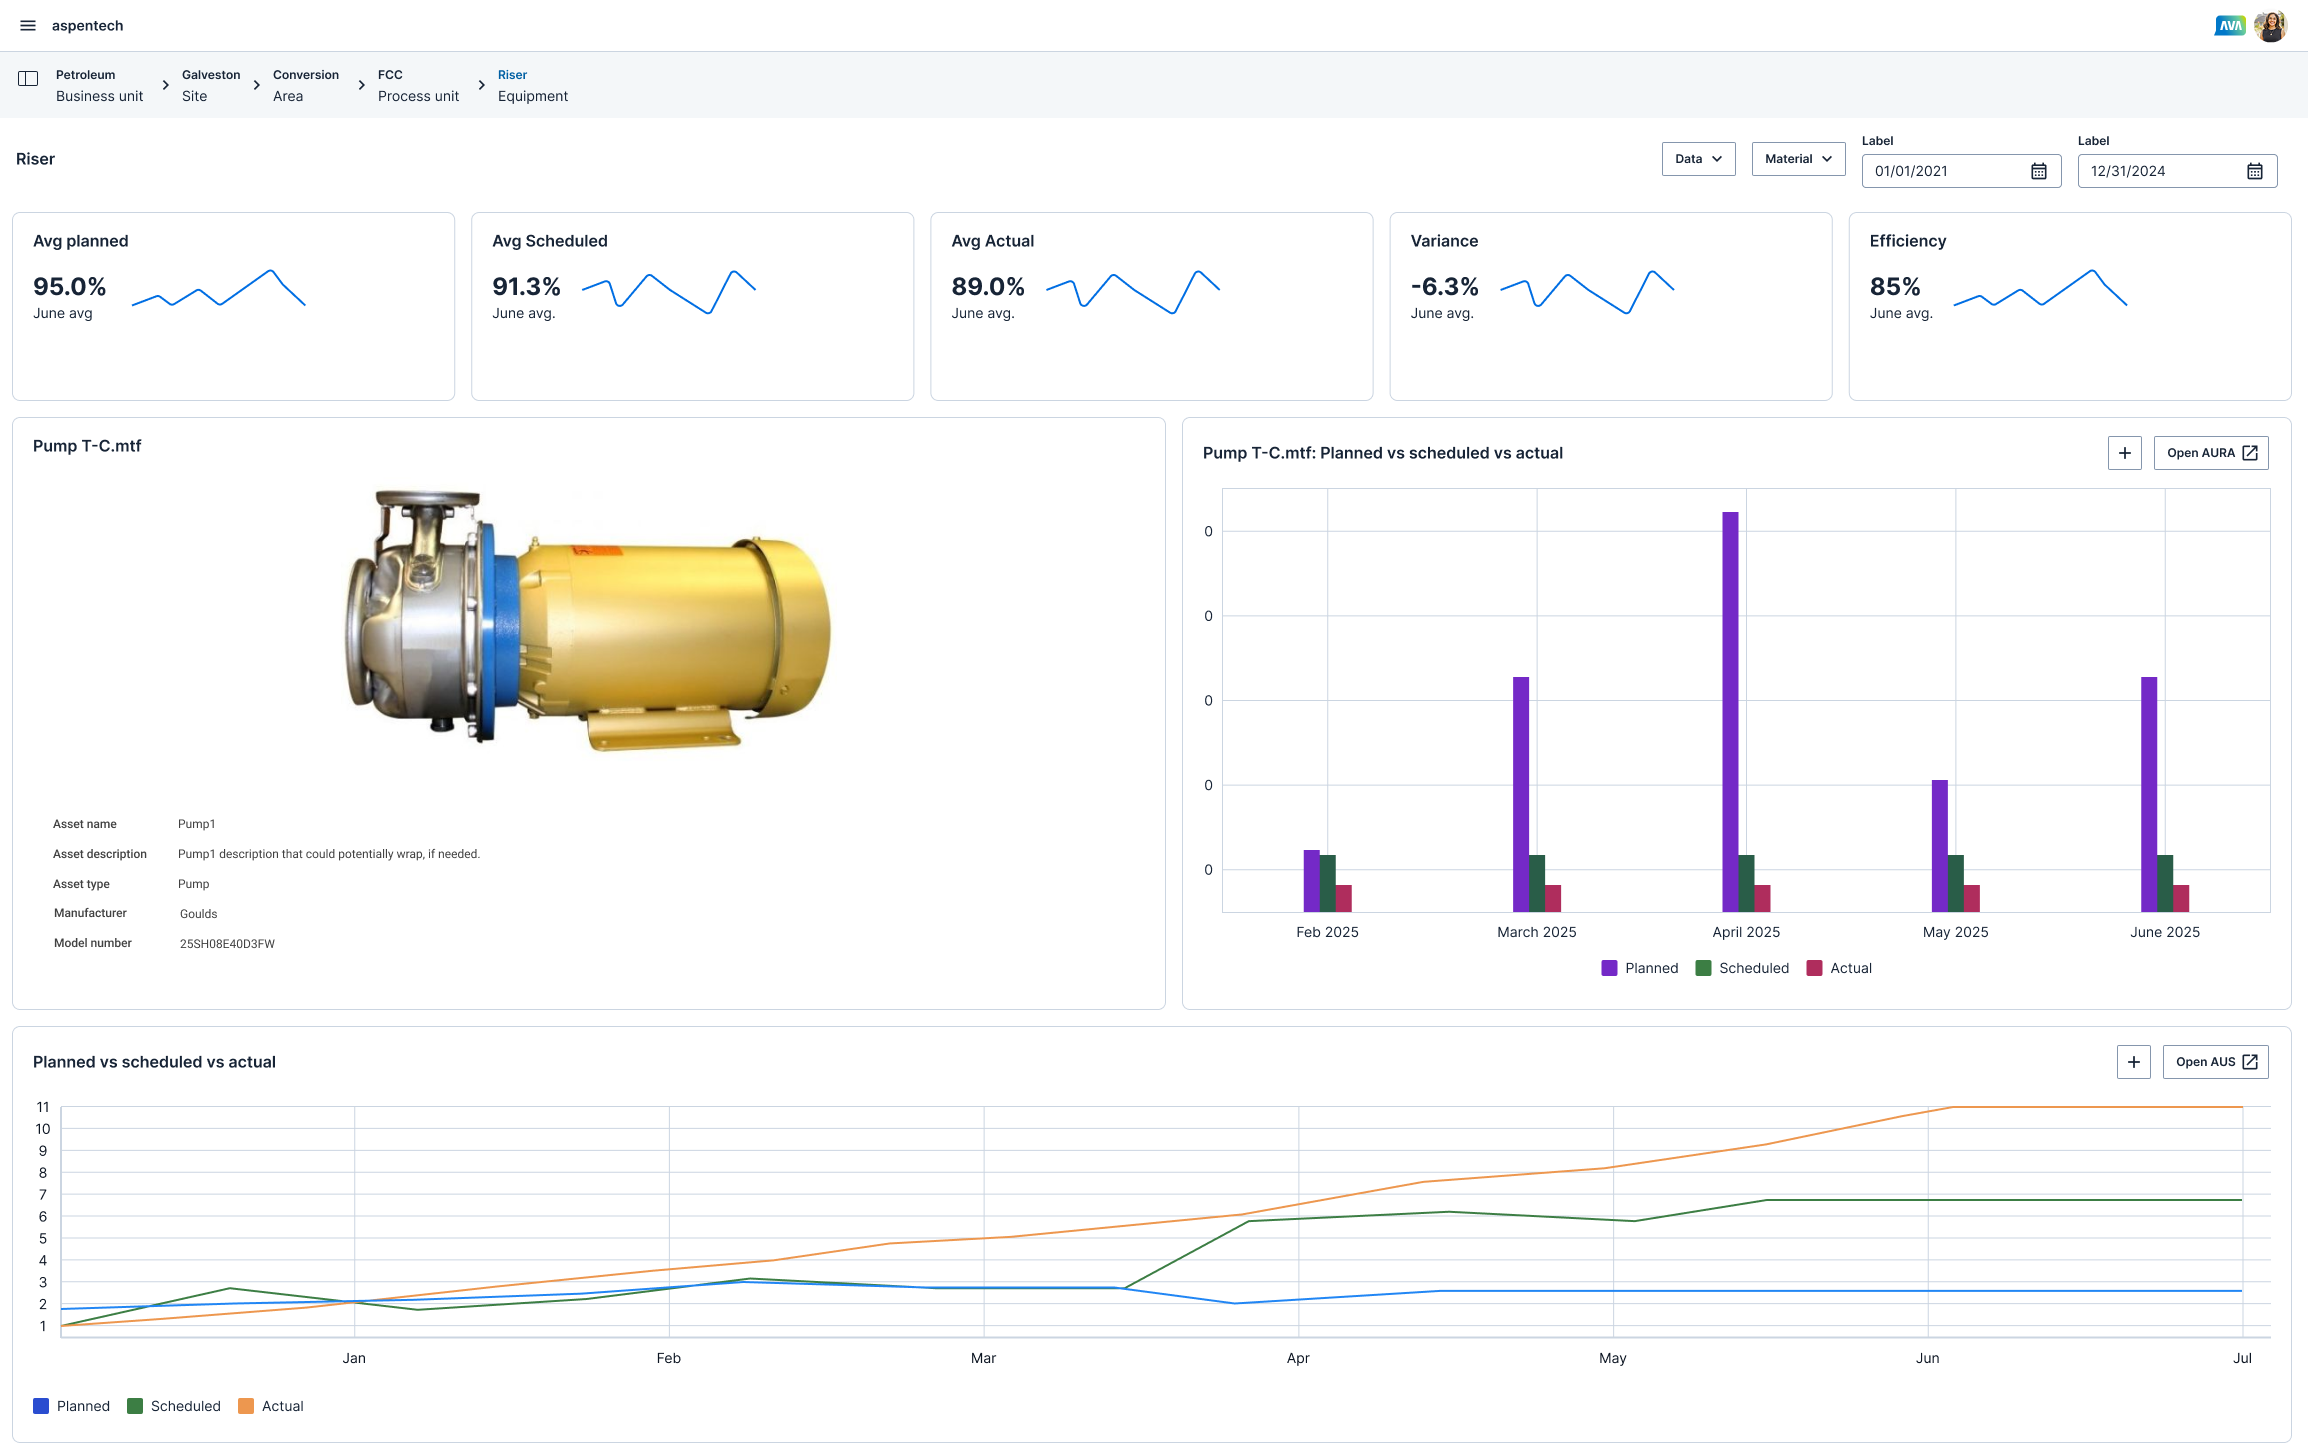
PSA - planned vs scheduled vs actual
A dashboard experience for users to drill down to any level from an enterprise to an equipment in an organization and compare planned, scheduled and actual data.
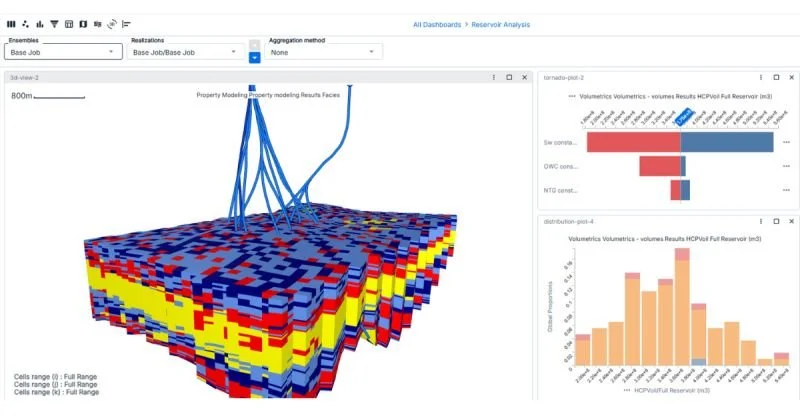
Subsurface engineering
Post processing analytics. A dashboard experience in which users, add results from multiple applications to visualize a reservoir model.
It gives users flexibility to build their desired dashboard using any type of results and charts.
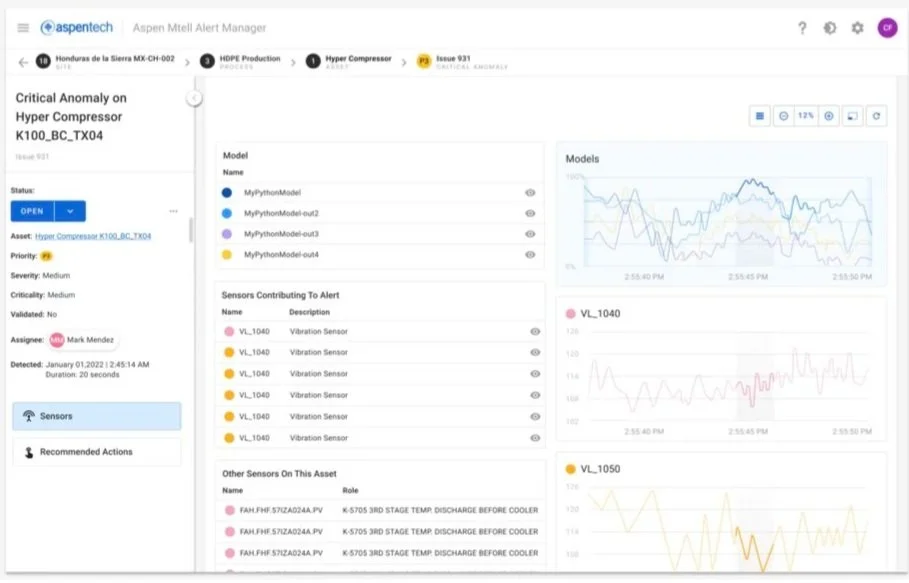
Alert manager
A dashboard experience to view and analyze live and historic data.